Every sale has a journey and a story. Marketing attribution reveals that story. It takes you beyond vanity metrics, and gives you real answers: Where did the lead first meet your brand? What prompted them to buy, and what happened in between?
84% of companies use more than one marketing channel, but how many are measuring the impact of each channel at different stages of the funnel? According to eConsultancy, less than one third of businesses use a defined attribution model across marketing campaigns. So, it comes as no surprise that 43% of companies list “measuring ROI” as their top marketing challenge.
Traditional attribution methods don’t paint the full picture; in a MMAGlobal case study, researchers found there is almost no correlation between click-through rate and sales. It’s too simplistic. So what are the various attribution models and what are the pros and cons of each?
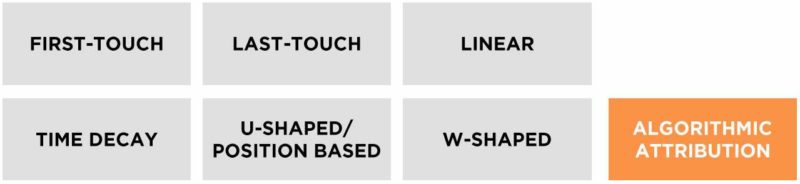
First Touch
First touch attribution gives 100% of the credit to the first touch point in the journey. The logic with this model is simple: no sale ever gets made if a business doesn’t know you exist. This model is not widely used, especially in categories where the first touchpoint is usually several steps away from the point of conversion.
PROS
- Easy to set up
- Helpful for marketers who are solely focused on demand generation and brand awareness
CONS
- Only tells part of the story
- Overvalues top-of-funnel campaigns
Last Touch
This model has the simplicity of the first-touch model, but instead shifts all the credit to the final step in the conversion path. It focuses on the last thing that triggered the conversion while ignoring the path up to that point. Last Touch is the most widely-used model and the best use-case would be conversion focused campaigns.
PROS
- Highlights channels that directly lead to revenue
- If conversion is the top goal, this model is most useful to use
CONS
- Ignores all the steps that were taken up until the point of conversion
- Doesn’t paint a fully accurate ROI picture
Linear
A linear attribution model divides credit equally between each touch point. The first touch, last touch, and any intermediate events are all treated with the same importance. This model is best used in campaigns that have a longer sales cycle.
PROS
- Linear attribution is a step up from first or last touch attribution because gives credit to mid-journey activities
- A linear model can be a useful benchmark to compare against other models
CONS
- Not all touch points are created equal
Time Decay
Time decay attribution assigns more credit to touchpoints closer to the point of conversion. It’s a multi-touch model that aims to acknowledge different touch points along the customer journey have different value. Marketers who believe their campaigns are bringing in high quality traffic, but are seeing low overall conversion rates should consider time decay attribution because it focuses on optimizing the later stages of the funnel.
PROS
- Optimize touchpoints that lead to (and directly result in) conversion
- Looks at the entire journey
CONS
- Early touches can still be very influential
U-Shaped
This model assigns more value to the first and last touchpoints. 40% credit to the first touch and 40% to the last touch, then divides 20% evenly between every middle point. A U-shaped model works best for campaigns that aren’t designed to nurture leads over a long period of time. If lead nurturing is an important part of the buyer journey, this model undervalues the middle stages of your campaign.
PROS
- Less heavy-handed than first or last touch attribution, but still places importance on the initial interaction and the final point of conversion.
CONS
- Depending on the campaign, the first and last touches could be unimportant.
W-Shaped
W-shaped still assigns the most weight to the first and last touchpoints, similar to the U-Shaped model. Also gives more credit to the point where a prospect converts to a lead. Attributes the most value to three main customer journey stages — visit, lead, and opportunity/sale. The three touch points receive 30% credit each, and the last 10% is split across the others. It goes another level deeper than the U-Shaped model, and should be used across multi-touch campaigns where there will be important lead conversion events in the middle of the buyer journey.
PROS
- Gives credit to all the touchpoints, while placing higher weighting on key action-based events.
CONS
- Complex set-up
- Undervalues other touchpoints.
How do you decide?
What are the average number of touch points prior to conversion?
The more touch points, the more nuanced the model. A last touch model would leave a lot of questions unanswered and be unhelpful for optimizing the nurturing phase of longer B2B sales cycles. However, for a direct response campaign the last touch model would work.
How long does it take for a lead to convert?
Simple models like linear and first touch don’t tell the whole story for long sales cycles; the longer it takes for a lead to convert, the more likely it is that the journey is complex and might involve multiple revisits, competitor evaluations, and retargeting months down the line.
How many active channels are you using in your sales cycle?
Multichannel reports give you a clue as to the timing, length, and path trends of your campaigns, which in turn inform your choice of model. The fewer channels involved in a conversion, the simpler the model you can use. Complex paths over long periods oftime may well require algorithmic (or at least W-shaped) attribution models.
What are you trying to measure?
Demand generators care about the marketing efforts that bring the most leads in through the door, so a first touch model is ideal. For conversion marketers, however, first touch alone would be unwise because it doesn’t credit the touch that converted the lead. Your goals and desired insights define the “right” model for the use case.
Compare, test, and optimize.
Ultimately, a correctly-configured custom or algorithmic model gives the best insights, and the more you test and optimize the closer you get to a model that works.